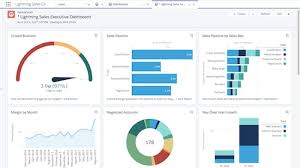
Recently, I was having a discussion with an executive team. Proudly, they said they were data driven and bragged about the dashboards they used to manage the business. They asked me to look at the dashboards to provide recommendations about what they might be doing.
I looked at the dashboards, at first glance, I was impressed–tracking pipeline, tasks, lead disposition, prospecting, mix, accounts, perormance by sales person, and more. Very impressive, pretty much what I would want–in fact it made my job working with them much easier–they had most of the data I would want to look at.
Then I started looking more deeply. The pipeline had lots of obvious “issues,” 15 % of the opportunities had close dates in the past, 30% of the qualified opportunities had no stage changes or even activities in the past 90 days, there were numerous quality and integrity exposures.
I moved on to the next chart in their dashboard–open tasks and next steps on deals, account, and territory plans. Again, as I looked at the detail, 37% of the tasks had past due completion dates, 5% were more than a year past due.
As I went through report after report I found similar issues.
Before you think this is a special case or that I am exaggerating, the majority of organizations I encounter have reams of data, more dashboards than one could ever guess what they could be used for. But when I drill down into the reports and data, there are huge problems.
Dashboards and data are meaningless unless you use them! Sadly, too many managers don’t use them, or maintain their private spreadsheets, or just track the one or two pieces of data they have always tracked (usually orders/revenue for the month/quarter/year.
When I point out the issues I observe-for example those I outlined at the top of this post with this one company, people are often amazed (ironically not embarrassed). “How did you see that? We never realized this! This is amazing insight!” I’m delighted they think I’m earning my exorbitant fees, but they should have seen these things themselves. They see it every day, week after week, month after month. I spend 30 minutes and start asking them about issues they could have seen and started addressing.
Having dashboards doesn’t improve performance. You have to look at the dashboards and begin to understand the data.
Understanding the data, doesn’t solve problems (for those who hide behind their screens staring at dashboards and doing nothing.). But the data helps you identify potential issues to dive into and understand–through talking to your people, working with customers, learning what’s behind the data, what’s actually driving the numbers.
We are fortunate that so many tools provide us data and insights we have never easily been able to get in the past. But you have to use it, understand it, learn what’s causing it, then take corrective action. Otherwise it is meaningless.

“Having dashboards doesn’t improve performance.” TRUE
“You have to look at the dashboards
and begin to understand the data.”
Data, needs to be transformed into USEFUL Information.
Charts are good, they make data easier to understand.
Sometimes the simplest way to display Data as Information,
is Red, Amber and Green lights. And, everybody who drives knows what action to take Red means STOP, Green means GO,
& Amber means Go, but very carefully.